Combining and cleaning reviews data
R
In my previous blog post, I talked about the project I was doing for Suckerpunch bar, using reviews and ratings to help influence business decisions. In the last post, I demonstrated how I scraped the reviews from four different platforms and created a separate data frame for each platform.
This post focuses on the combining and cleaning of this data, as well as some initial insights into ratings over time.
library(dplyr)
library(readr)
library(ggplot2)
ta <- read_csv("ta_reviews.csv")
fb <- read_csv("fb_reviews.csv")
dmn <- read_csv("dmn_reviews.csv")
ggl <- read_csv("google_reviews.csv")
First, I tidied all tables by ensuring all columns are in the right order, all column headers are the same and all data types are correct.
The TripAdvisor reviews had both headlines and review text, while the others have just review text. To uniformise the review text from all platforms, I will concatenate the text from the headline quote to the review text to create one ‘Review’ column.
colnames(ta) <- (c('X', 'Id', 'Date', 'Rating', 'Headline Quote', 'Review_1.0'))

ta$Review <- paste(ta$'Headline Quote', ta$Review_1.0, sep = " ")

ta <- select(ta, 'Date', 'Id', 'Rating', 'Review')

ta$Date <- as.Date(ta$Date, format = "%d/%m/%Y")
Facebook reviews
colnames(fb) <- (c('X', 'Date', 'Rating', 'Id', 'id', 'Review'))

fb <- select(fb, 'Date', 'Id', 'Rating', 'Review')

fb$Date <- as.Date(fb$Date)
DesignMyNight reviews
colnames(dmn) <- (c('X', 'Date', 'Id', 'Rating',  'Review'))

dmn <- select(dmn, 'Date', 'Id', 'Rating', 'Review')

dmn$Date <- as.Date(dmn$Date, format = "%d/%m/%Y")
Google reviews
Due to the messy process I went through to get the reviews from Google, a lot more manipulation and cleaning needed to be done.
colnames(ggl) <- (c('X', 'Id', 'Date_old', 'Review', 'Rating'))

ggl <- select(ggl, 'Date_old', 'Id', 'Rating', 'Review')
The date formats that the reviews from Google needed changing to match that of the other reviews. I’ll create a reproducible function for this that takes a relative date (ie. “a month ago”) and produces a usable date format.
library(lubridate)
change_date_format <- function(df) {
    df2 <- df %>%
    mutate(Date = case_when(Date_old == 'a month ago' ~ Sys.Date() %m-% months(1),
                  Date_old == '5 months ago' ~ Sys.Date() %m-% months(5),
                 Date_old == '4 months ago' ~ Sys.Date() %m-% months(4),
                 Date_old == '8 months ago' ~ Sys.Date() %m-% months(8),
                 Date_old == '2 months ago' ~ Sys.Date() %m-% months(2),
                 Date_old == '11 months ago' ~ Sys.Date() %m-% months(11),
                 Date_old == 'a year ago' ~ Sys.Date() %m-% years(1),
                 Date_old == '2 years ago' ~ Sys.Date() %m-% years(2),
                 Date_old == '10 months ago' ~ Sys.Date() %m-% months(10),
                 Date_old == '7 months ago' ~ Sys.Date() %m-% months(7),
                 Date_old == '6 months ago' ~ Sys.Date() %m-% months(6),
                 Date_old == '2 weeks ago' ~ Sys.Date() %m-% weeks(2),
                 Date_old == '3 months ago' ~ Sys.Date() %m-% months(3),
                 Date_old == '3 days ago' ~ Sys.Date() %m-% days(3))
                        )
    df2$Date <- as.Date(df2$Date, format = "%d/%m/%Y")
    final_df <- select(df2, 'Date', 'Id', 'Rating', 'Review')
    return(final_df)
}
ggl <- change_date_format(ggl)
I combined all tables into one, to create a “master” review data frame
reviews_df <- bind_rows(Facebook = fb, TripAdvisor = ta, DesignMyNight = dmn, Google = ggl, .id = "Site")
write.csv(reviews_df, file = "reviews_df.csv")
Net Promoter Score analysis
Now I have all the data I need, what is the overall score?
nps <- round(summarise(reviews_df, NPS = mean(Rating)),1)
nps
| 4.6 |
4.6 out of 5 - not bad!
What about by month since the first review?
reviews_df$Month <- format(as.Date(reviews_df$Date), "%y-%m")
ordered <- reviews_df %>%
    arrange(Month)
distinct_months <- unique(ordered$Month)
vector <- c(1:length(distinct_months))
avg_month_function <- function(i) {
    reviews_df %>%
    filter(Month >= distinct_months[1] & Month <= distinct_months[i]) %>%
    summarise(Avg_by_month = mean(Rating))
}
avg_month_result <- lapply(vector, avg_month_function)
avg_month_no_months <- plyr::ldply(avg_month_result, data.frame)
df <- data.frame(distinct_months)
avg_months <- bind_cols(df, avg_month_no_months)
reviews_plot <- ggplot(avg_months, aes(x = distinct_months, y = Avg_by_month, group = 1)) +
    geom_line(color = "#f5e2a8") +
    theme_minimal() +
    labs(title = "Rating per month",
        x = "Month",
        y = "Rating") +
    theme(axis.title.x = element_text(face="bold", size=10),
           axis.text.x = element_text(angle=90, vjust=0.5))
print(reviews_plot)
ggsave("plt.png", width = 16, height = 9, dpi = 120)
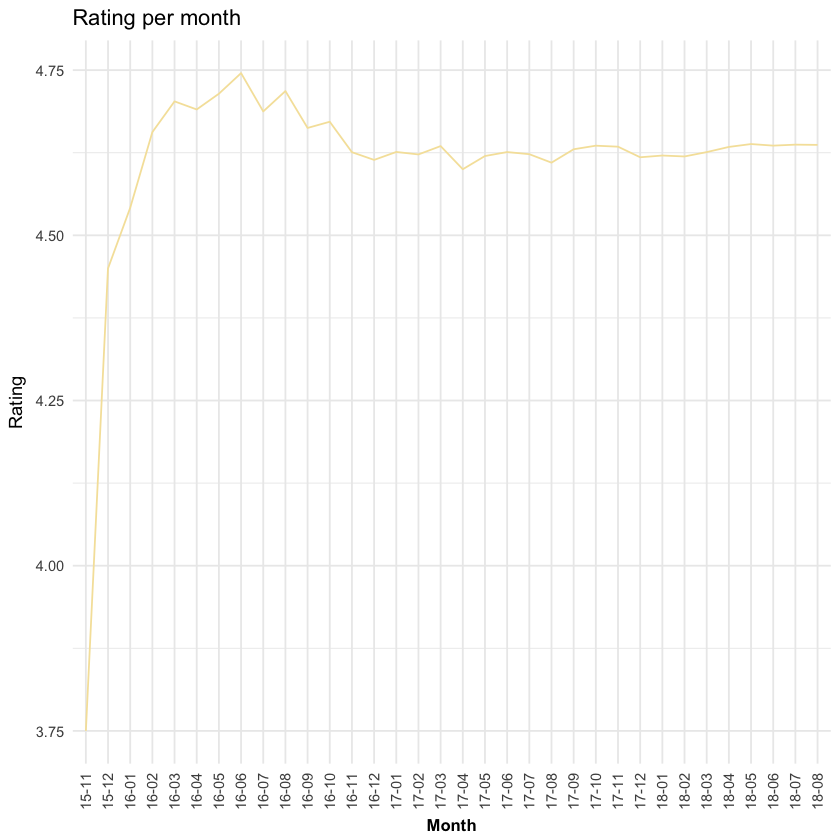
This shows us the average rating every month since Suckerpunch opened. Things started with a relatively low score which climbed significantly over the first 8 months. The score has now plateaued at around 4.6.
In the next blog post, I’ll look at the text in the reviews themselves and see what insights we can find.