Creating wordclouds from reviews
R
In the last post, I created a master data frame from the scraped reviews and did some initial ratings analysis.
In this post, I’ll be focusing on the text itself to see what Suckerpunch do well and what could be improved.
library(tm)
library(dplyr)
library(wordcloud)
I imported the reviews that I used and dropped the reviews with no text.
reviews <- read.csv("/Users/jasminepengelly/Desktop/EARL/reviews_cleaned_df.csv", stringsAsFactors = FALSE)
reviews <- select(reviews, -X)
non_null_reviews <- filter(reviews, Review != "NA")
I then created a “good” and “bad” corpus - the good containing reviews with a rating of 4 plus, and bad containing reviews with a rating of maximum 2. I then manipulated them into a VCorpus object.
good_reviews <- non_null_reviews %>%
    filter(Rating >= 4) %>%
    select(Id, Review) %>%
    rename(doc_id = Id, text = Review) %>%
  DataframeSource() %>%
  VCorpus()

bad_reviews <- non_null_reviews %>%
    filter(Rating <= 2) %>%
    select(Id, Review) %>%
    rename(doc_id = Id, text = Review) %>%
  DataframeSource() %>%
  VCorpus()
I defined the stopwords, using the English dictionary and including “cocktail” and “bar”. I added more words to this generating the word cloud to make sure I only kept the ones that gave insight.
Once this was done, I defined a function to preprocess the text.
stopword_additions <- c("cocktails", "cocktail", "sucker", "suckerpunch", "bar", "will", "back", "really", "definitely", "always", "made", "can", "even", "just", "little", "book", "look", "get", "sure", "went", "like", "cant", "one", "couldnt", "also", "bit", "going", "way", "much", "didnt", "got", "sat", "dont", "though", "want", "come", "pre", "make", "see", "ive", "although", "however", "now", "say", "still", "try", "100", "wont", "two")

stopwords <- c(stopword_additions, stopwords("en"))

preprocess <- function(x) {
  x <- tm_map(x, content_transformer(tolower)) %>%
  tm_map(removePunctuation) %>%
  tm_map(stripWhitespace) %>%
  tm_map(removeWords, stopwords) %>%
  return()
}

good_corpus <- preprocess(good_reviews)
bad_corpus <- preprocess(bad_reviews)
To visualise this data, I made TDMs and word clouds. Since there were fewer negative reviews, the “bad review” wordcloud had fewer words so as not to give too much weight to words that are infrequently used.
good_tdm <- as.matrix(TermDocumentMatrix(good_corpus))
good_tdm_rows <- rowSums(good_tdm) %>%
  sort(decreasing = TRUE)
bad_tdm <- as.matrix(TermDocumentMatrix(bad_corpus))
bad_tdm_rows <- rowSums(bad_tdm) %>%
  sort(decreasing = TRUE)
Good review word cloud
library(viridisLite)
colour = cividis(n=3)

good_word_freqs <- data.frame(term = names(good_tdm_rows),
                         num = good_tdm_rows)
wordcloud(good_word_freqs$term, good_word_freqs$num, max.words = 100, colors = colour)
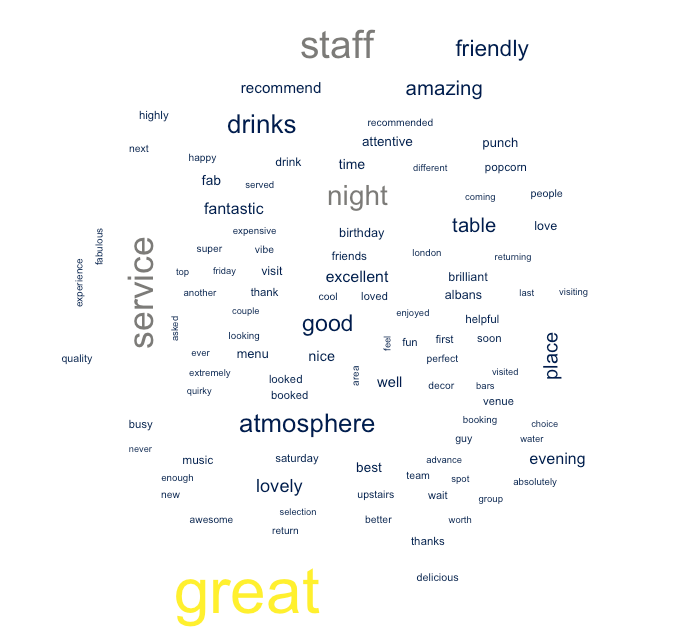
The words that stand out here are great, service, staff, atmosphere, night, good, drinks and friendly. From this, I would say it looks like Suckerpunch creates a great atmosphere with crowd-pleasing drinks, and that the staff come across as friendy and attentive.
Bad review word cloud
bad_word_freqs <- data.frame(term = names(bad_tdm_rows),
                         num = bad_tdm_rows)
wordcloud(bad_word_freqs$term, bad_word_freqs$num, max.words = 50, colors = colour)
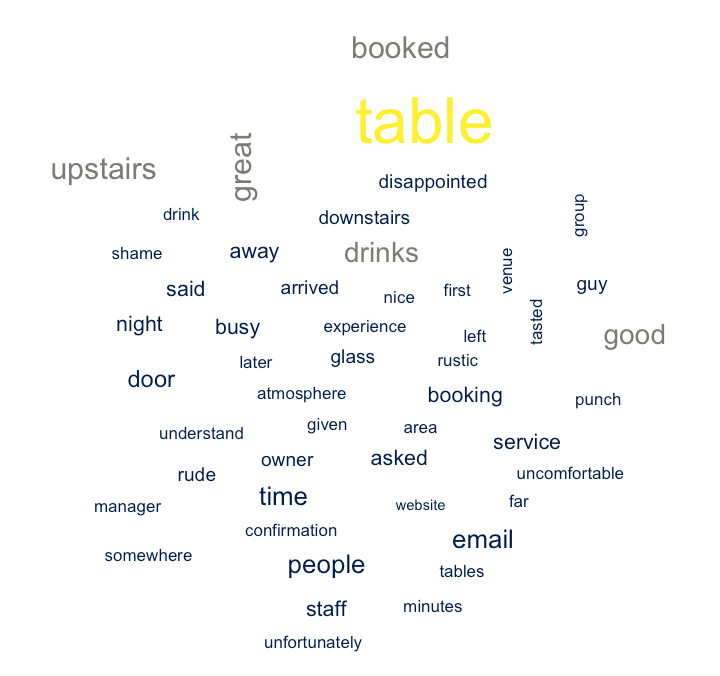
The words that stand out here are table, upstairs, booked, drinks, manager, and rude. The manager has come across rude to somebody at some point, and there seems to have been some negative experiences around booking tables (I am told people often don’t know they have to book and are disappointed when not allowed in or having to leave early). Busy and service imply to me that service could potentially be improved on busy nights.
How does the ratio of good and bad reviews change each month?
There were some key changes to the bar, such as management changes and refurbishments that may have affected the ratings Suckerpunch during that month.
reviews$Month_Yr <- format(as.Date(reviews$Date), "%Y-%m")

good_bad_split <- reviews %>%
  mutate(Bad_review = Rating <= 2,
         Good_review = Rating >= 4) %>%
  group_by(Month_Yr) %>%
  summarise(Good_review = round(mean(Good_review == 1), 2),
            Bad_review = round(mean(Bad_review == 1), 2))

good_bad_split %>%
    ggplot(aes(Month_Yr, group = 1)) +
  geom_line(aes(y = Good_review, colour = "Good reviews (4+)")) +
  geom_line(aes(y = Bad_review, colour = "Bad reviews (2 and below)")) +
  labs(title = "Good vs bad reviews over time",
     y = "Share of total reviews per month",
     x = "Month") +
  theme_minimal() +
  theme(axis.title.x = element_text(face="bold", size=10),
           axis.text.x  = element_text(angle=90, vjust=0.5)) +
  scale_y_continuous(labels = scales::percent) +
  scale_color_manual(values=c("#191919", "#f5e2a8")) +
  theme(legend.title=element_blank())
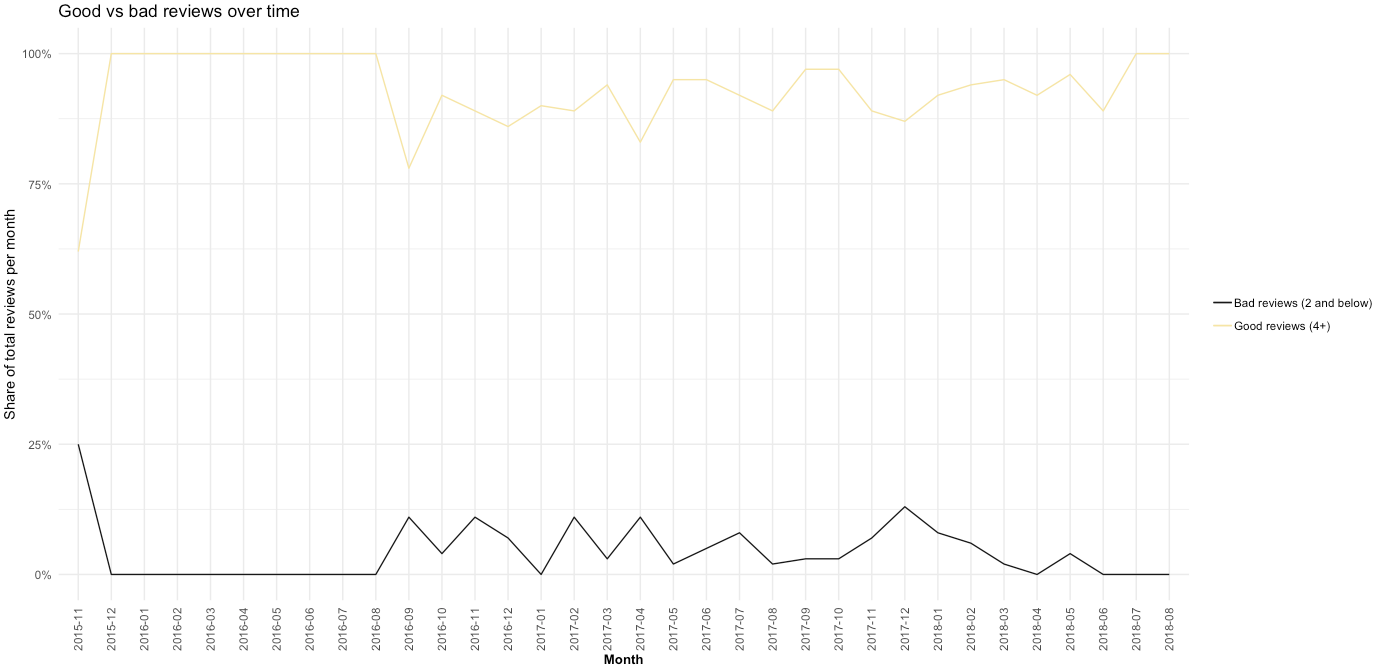
The first month, November 2015, was not a good one - 25% of the reviews received were considered bad. Suckerpunch experienced some teething issues on the first night, such as a powercut and some cocktail ingredients running out.
Luckily, things improved immediately after right up until August 2016, when 100% of reviews received were positive. However, a new business partner was brought in early 2016 until August 2017. We can see here the percentage of negative reviews received is highest around this time.
In February 2018, the bar was refurbished to become bookings and seating only. This seems to improve the reviews given, apart from May and June this year where there was a slight dip.
I am very happy with the insights pulled from the reviews data. In the next blog post, I’ll analyse cocktail sales data to see what can be discovered there.